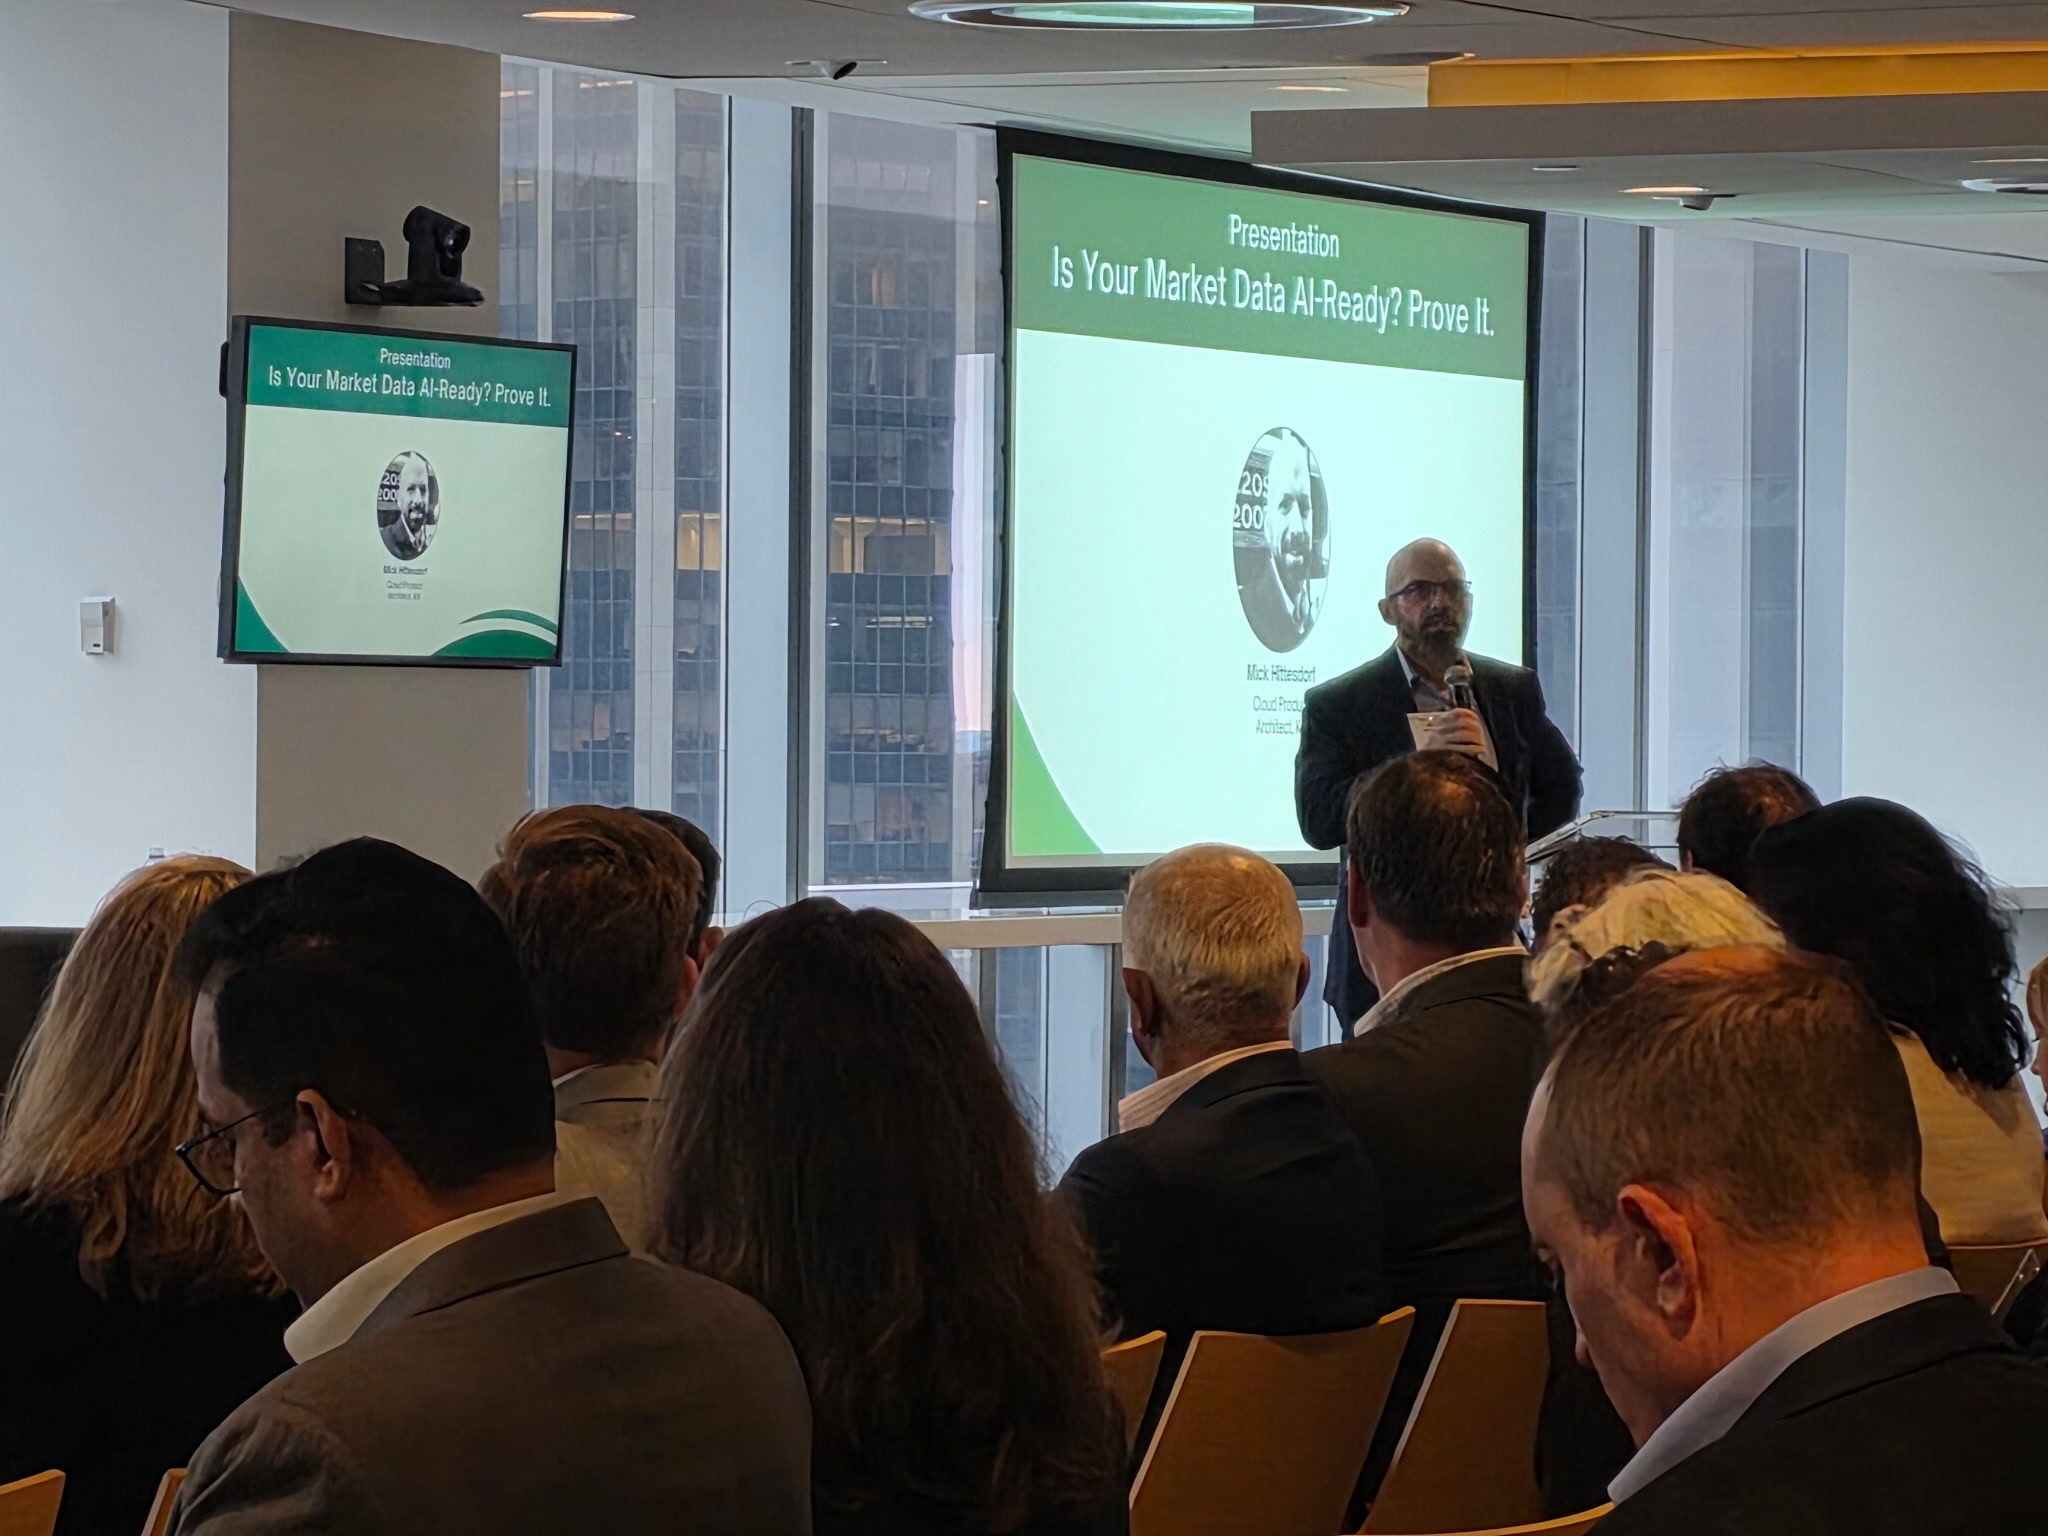
By Mick Hittesdorf, Senior Cloud Architect, KX
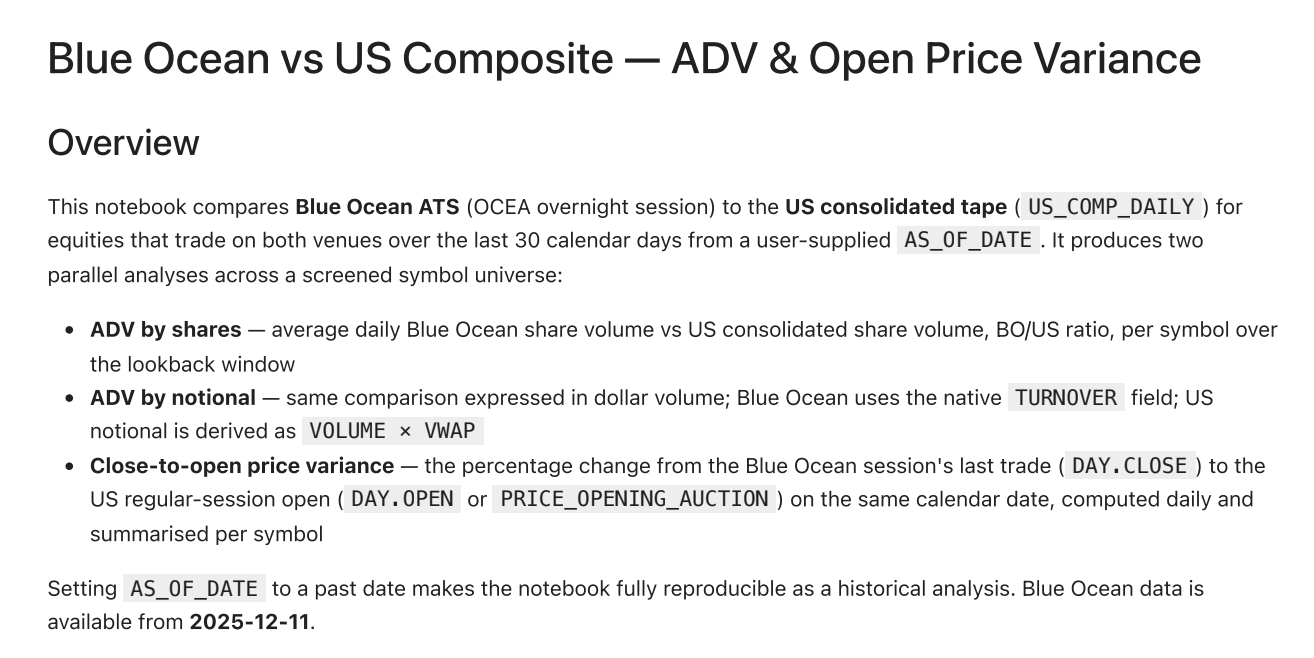
Recently, I decided to put our own OneTick Cloud data to the test by launching a deep quantitative research study comparing Blue Ocean ATS overnight trading activity and closing prices to the US composite equity opening prices. My goal was to answer two critical market-microstructure questions:
- How much overnight liquidity exists on Blue Ocean for high volume US equities?
- Does the Blue Ocean overnight close efficiently predict the US regular-session open?
Normally, spinning up a multi-venue research study like this—spanning 30 calendar days of high-frequency tick data across over 7,400 symbols—would take a quant or data engineer weeks to acquire the research data set, clean and align the data, and write the Python analytics code
Instead, I completed this entire project in just 4 hours.
How? By combining the high-performance data infrastructure of OneTick Cloud with the collaborative coding power of Claude Code. Here is how I did it, what I discovered about overnight liquidity, and why this represents the future of quantitative research workflows.
The Stack: OneTick Cloud + Claude
One of the biggest impediments to any modern data platform is the "data gravity" of legacy architecture and the painful "plumbing" of data ingestion and cleaning. Capital markets data is notoriously unforgiving—without clean, normalized, and contextualized tick data, your analytics and AI models will stumble ("garbage in, garbage out").
1. The Data Backbone: OneTick Cloud
With OneTick Cloud, the hard problems of market data acquisition, ingestion, cleaning and access are handled for you. Historical tick data is already normalized, adjusted for corporate actions, and stored in highly available partitioned Parquet format on AWS S3. Parquet’s columnar storage is optimized for analytics-heavy queries, so years of historical data can be queried efficiently and economically.
2. The AI Quant: Claude Code
Rather than writing every line of Python from scratch, I leveraged Claude Code through the Jupyter AI extension to rapidly implement, test and validate the study’s data access, analytics and charting code.
Using onetick-py, which Is OneTick’s pandas-like Python API, I designed a query strategy using bulk queries to minimize round trips, fetching daily volume, turnover, close prices, and opening auctions, and then performed all of the heavy-duty data dataframe merging and statistical variance computations in the Jupyter notebook kernel.
Whenever I needed to generate complex matplotlib visualizations—such as grouped ADV horizontal bar charts, sequential blue-ramp ratio bars, small-multiple daily variance lines, or frequency distribution histograms—I simply described the desired layout to Claude. Claude drafted and refined the visualization code on the fly. When minor errors arose, I used the chat context to iteratively debug and self-correct the code in seconds.
The exponential increase in productivity afforded by AI, married with clean, easily accessible, trusted, AI-ready data, is what enables a quantitative developer or researcher to produce a complex, sophisticated analysis in hours rather than days or weeks.
Key Insights from the Blue Ocean ATS Study
By executing the Jupyter notebook on a 30-day lookback window (from June 30 to August 17, 2026), I surfaced fascinating structural insights into US overnight market dynamics:
1. Semiconductor Risk is the Primary Overnight Use Case
Our ADV analysis showed that the semiconductor sector absolutely dominates Blue Ocean’s overnight activity.
- Hedging Demand: SOXS (a 3x leveraged semiconductor bear ETF) represents the primary overnight hedging vehicle, maintaining an average daily Blue Ocean volume of 10.2M shares—yielding a massive BO/US volume ratio of 3.90% (5x to 20x higher than any other name). This is because the overnight session (~8 PM to 4 AM ET) perfectly aligns with trading hours in South Korea, Taiwan, and Japan, precisely when critical tech news and earnings flow.
- Directional Positioning: Memory chip giants Micron (MU) and SanDisk (SNDK) dominated the notional (dollar-value) universe, posting overnight ADVs of $716.6M and $493.4M respectively. Together, they represented over $1.2B of the top 5 names' notional volume, showing intense overnight directional positioning.
2. High Overnight Volume Does Not Mean Tight Pricing
One of the most valuable findings for execution quants is the relationship between volume and price variance. Despite being the most heavily traded names overnight, SNDK and MU exhibited the most unpredictable close-to-open price gaps in our entire notional study:
- SNDK: standard deviation of 9.29% and a maximum gap of 21.06%.
- MU: standard deviation of 6.27% and a maximum gap of 15.90%.
In contrast, mega-cap names with far lighter overnight volume, like Apple (AAPL) (std 2.08%, max gap 7.10%) or Microsoft (MSFT) (std 1.93%, max gap 5.98%), are priced much more tightly. For quants, this means that the Blue Ocean close in semiconductor names should be treated as a reference point rather than a precise price anchor.
3. Continuous Global Pricing Erases the Overnight Gap
Our analysis of BITO (ProShares Bitcoin ETF) perfectly demonstrated what a continuous, 24/7 global market does to price variance. Because Bitcoin trades around the clock on global exchanges, the Blue Ocean session is simply another slice of a continuously priced market with zero information asymmetry. BITO registered the tightest variance in the shares universe, with a standard deviation of just 1.46% and a maximum gap of 2.56%.
4. Index Arbitrage Forces Extreme Pricing Efficiency
Both SPY (mean variance -0.05%, std 0.71%) and QQQ (mean variance +0.02%, std 1.37%) showed signed mean variances near zero. This is because overnight index prices are continuously arbitrage-aligned with highly liquid CME futures (ES and NQ) trading overnight, making the Blue Ocean index close an incredibly reliable pre-open reference.
5. Persistent Directional Bias in SpaceX (SPCX)
SPCX (SpaceX Class A) was the only name (other than Nvidia) to appear in both our top share-volume and top notional-volume universes. It exhibited a persistent positive directional bias, with a mean variance of +0.73% and 67% of trading days closing positive. This suggests overnight sellers of SPCX are systematically accepting a discount to get immediate overnight liquidity before the US regular session opens.
6. Left-Skewed Overpricing in Microsoft (MSFT)
Interestingly, MSFT was one of the few names where overnight buyers systematically overpaid. With a mean variance of -0.51% and a distinct left-skewed distribution, the US regular session opened lower than the Blue Ocean overnight close on the majority of trading days, indicating that overnight MSFT execution heavily favored sellers.
7. Macro-Driven Volatility Compression
By placing our daily variance charts side-by-side (rendered perfectly by Claude), we spotted a stark macro regime shift: MU, SNDK, AMD, QQQ, and NVDA all show highly elevated variance volatility in the July 1-22 window, which then compressed to near-flat levels from July 28 onward. This joint compression points to macro-structure drivers—like squared positioning ahead of the late-July FOMC meeting—which systematically reduced reference-price risk across the entire market.
The Paradigm Shift in Quant Workflows
For years, quants and data scientists have been bogged down by the "plumbing" of data engineering—spending 80% of their time cleaning dirty files, aligning timestamps, and handling corporate actions, leaving only 20% for actual strategic research.
This Blue Ocean study proves that the paradigm has shifted.
By leveraging OneTick Cloud, the data plumbing was entirely abstracted away. I didn't have to build data ingestion pipelines or write complex symbol-mapping databases; I had immediate, high-performance access to clean, multi-venue historical data.
By partnering with Claude via the JupyterLab AI extension, the code-writing and data-visualization steps were compressed from days of engineering into a rapid, conversational, iterative exercise.
This is how quantitative research is supposed to be. It frees quants to do what they do best: interpret the big picture, extract alpha-generating insights, and build sophisticated strategies.
Read the full insights here: Blue Ocean ATS — Trading & Risk Insights.
Run your own analytics today
The tools and modern data structures are ready. Whether you want to backtest overnight execution strategies, rebuild level 3 CME order books, or run real-time surveillance, OneTick Cloud provides the speed, scale, and AI-assisted workflows to keep you ahead of the market.
Start your free trial to OneTick Cloud here, and experience the SaaS + AI advantage for yourself.
Or if you’d like a copy of the Jupyter notebook (see below) and the full overnight trading study results feel free to contact me directly at mhittesdorf@kx.com
Best wishes,
Mick Hittesdorf